

These apps ruled over US residents’ screens and wallets in 2023،
Ah, time, that thing we can never get back. 2023 was the year our mobile screens saw more action than a Hollywood blockbuster. Thanks to a comprehensive report of data.aiwe know which apps took up most of US residents' time and money last year.
First of all, Americans were a little less glued to phones last year. The average daily screen time decreased from 4.42 hours in 2022 to 4.34 hours in 2023. It's not a massive drop, but hey, every minute counts in the digital world. For reference, let's zoom out and go global for a second. By 2023, the global average of daily screen time will reach 5 hours. This represents an increase of 6% compared to 2022.
Now let's dig deeper and see where all this time went.
Top App Subgenres by Downloads in 2023

Image credit–data.ai
Globally, the VPN Service and Web Accelerator apps were the standouts, with downloads growing 42%. But in the United States the situation was quite different. The crown went to HBO's Max, nestled in the entertainment subgenre. No big shock there, considering HBO Max 2023's transformation into the revamped Max streaming service, which has surely sparked quite a download frenzy! But it wasn't just about streaming shows and movies. Shopping app Temu has been making noise in the Shopping and E-Commerce subgenre. And let's not forget our old friend, WhatsApp Messenger, leading the Social Media & Communication category with a modest 3% growth.
But the real talk of the town was AI. Although the Generative AI and AI Chatbot category was at the bottom of the top 20, the ChatGPT app skyrocketed with 2,792% growth. For a beginner app, this may seem standard, but it's quite a success in every way. Bet on its growth in 2024? You wouldn't be the only one.
Top App Subgenres by Money Spent in 2023
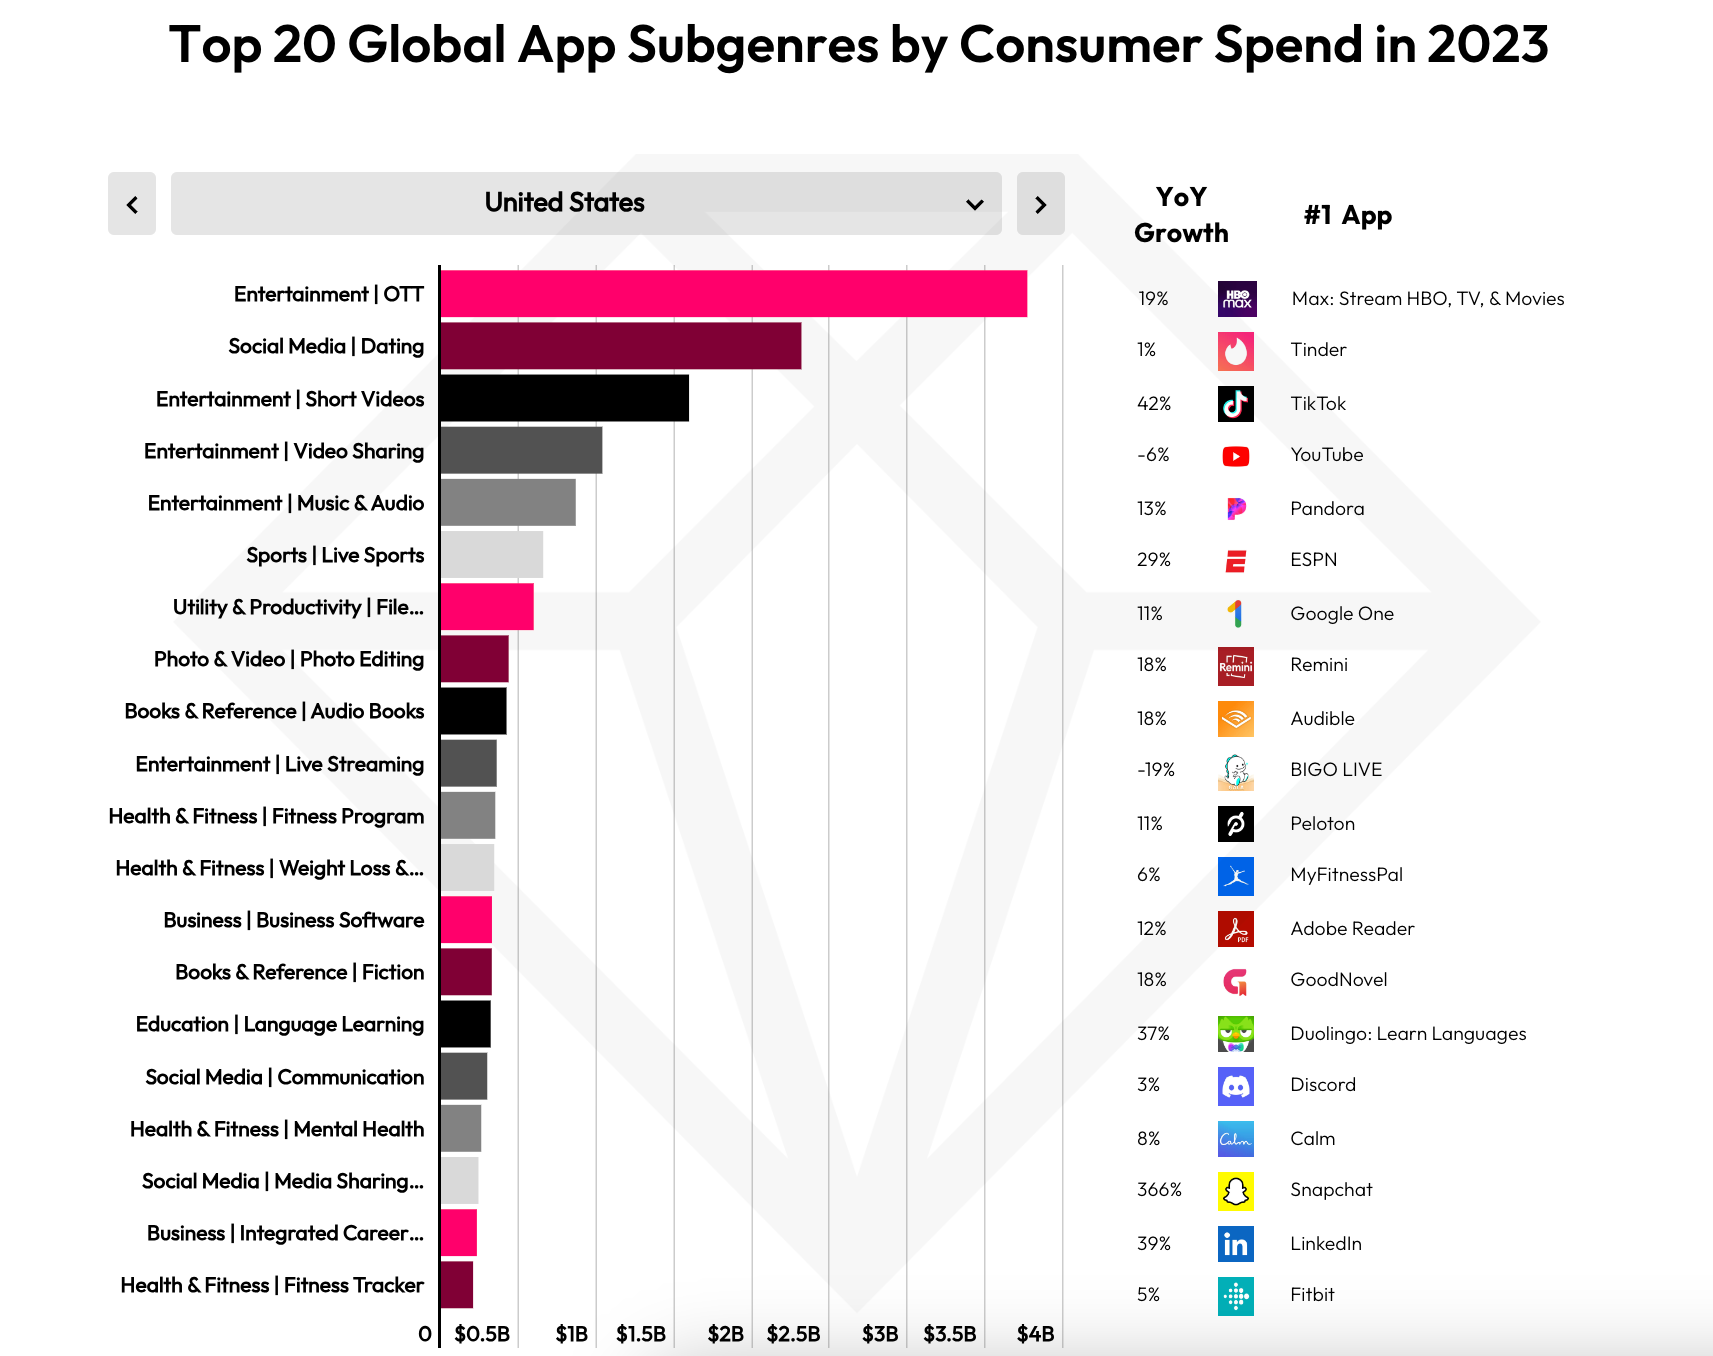
Image credit–data.ai
Now let's talk about how we spent our money. Max is at the top of the charts again. Second place goes to Tinder on social networks | dating subgenre. In the United States, Tinder helped people spend more than $2.3 billion, representing 1% year-over-year growth.
Not to be outdone, TikTok users were also opening their wallets, spending over $1.5 billion on the app. Interestingly, TikTok made history as the first app to reach a whopping $10 billion in total consumer spending.
Meanwhile, Snapchat wasn't just about filters; its numbers skyrocketed last year. While the app may not lead in overall consumer spending, it's making waves with a staggering 366% year-over-year growth. This impressive jump is largely attributed to its new subscription service.
In 2023, it was all about video in the U.S. consumer spending scene. The Over-the-Top (OTT) subgenre is topping the charts, showing us that streaming services are more popular than ever. And it wasn't just about binge-watching shows; short videos, video sharing and live sports apps also saw impressive double-digit growth compared to 2022.
Top App Subgenres by Time Spent in 2023

Image credit–data.ai
Let's move on to the category that might be the most crucial: the apps we invest our time in. In 2023, four of the top five subgenres in terms of time spent belonged to entertainment and social media. It's a big deal: these five subgenres alone take up more than two-thirds of the total time we spent on mobile apps. To give you an idea of the scale, consider this: On Android alone, globally, users spent 2.3 trillion hours on social media. Let's move on.
Unsurprisingly, YouTube took the top spot in terms of time spent in 2023. Everyone probably knows what YouTube is, and it's indeed the numbers that do the talking. Last year, U.S. residents collectively spent more than 40 billion hours watching YouTube content. This is a 1% increase from 2022, solidifying YouTube's place as the preferred digital entertainment destination.
In the world of applications, media sharing networks saw the strongest growth in 2023, with an increase of 35% year-on-year. Leading this charge were popular apps like Instagram and Snapchat. In contrast, traditional social networks have not changed much, remaining roughly stable compared to 2022.
There was also talk of them losing their advantage on microblogging platforms, like X (formerly Twitter). Despite new entrants like Threads trying to shake things up, the microblogging industry is no longer booming like it used to be. In fact, the time US users spent on X in 2023 decreased by 10% compared to the previous year.
Netflix also saw an 8% decline in time spent, mirroring the 8% growth of HBO's Max. Coincidence? I do not think so. On the other hand, Character.AI in the Generative AI and AI Chatbot subgenre is the application with the highest growth. US users have spent nearly 2 billion hours creating and chatting with AI characters.
So what's the bottom line? 2023 was a year where we juggled AI, social media, shopping, a little romance and, of course, lots of video content. Quite a year for our mobile applications, right?